
Global benchmarking map
A live view of PMO performance, worldwide.
Aggregated and anonymised data from PMO-MI® assessments across 38 countries today — and growing every week. This is a collaborative national benchmarking initiative designed to help associations understand and showcase PMO maturity and impact in their country.
At a glance
The network, today.
0+
Countries
With live assessments
0+
PMOs benchmarked
And growing weekly
0
Peer cohorts
Industry, size, region, type, maturity
Live benchmark
PMO maturity by country.
PMO-MI world maturity
Average maturity level by country, weighted by completed assessments.
01
CH
3.7
+0.12
02
FI
3.5
+0.21
03
DE
3.4
+0.18
04
EE
3.2
+0.16
05
SA
3.1
+0.34
06
PL
3.1
+0.17
07
CA
3.0
+0.09
08
LT
2.9
+0.13
09
LV
2.8
+0.14
10
KW
2.7
+0.20
11
ZA
2.6
+0.15
12
CL
2.5
+0.19
13
BR
2.4
+0.27
14
PE
2.4
+0.18
15
CO
2.3
+0.22
16
ID
2.2
+0.31
17
PK
2.1
+0.29
Cross-country radar
Three clusters. Seven leading markets.
Cross-country cluster radar
Alignment · Service · Impact — averaged per country.
Band distribution
Where each country's PMOs sit on the ladder.
Maturity band distribution
Share of assessments by PMO-MI band, per country.
Fragmented Developing Converged Integrated Synergized
CH
n=64
FI
n=89
DE
n=287
EE
n=41
SA
n=142
CA
n=178
BR
n=96
Momentum
The fastest-moving markets, right now.
Top movers — last quarter
Fastest growing national PMO benchmarks (QoQ).
#1 mover
Saudi Arabia
+0.34
avg now 3.10
#2 mover
Indonesia
+0.31
avg now 2.20
#3 mover
Pakistan
+0.29
avg now 2.10
#4 mover
Brazil
+0.27
avg now 2.40
#5 mover
UAE
+0.24
avg now 3.30
Peer cohorts
How a single PMO compares — five ways.
Peer benchmarking intelligence
Your score against five global cohorts.
Global Industry
Cohort avg3.1
Your score3.1
Percentile78th
0.0 below cohort
Global (All)
Cohort avg2.7
Your score3.1
Percentile82th
0.4 above cohort
Country (Switzerland)
Cohort avg3.4
Your score3.1
Percentile65th
0.3 below cohort
Similar Size
Cohort avg3.0
Your score3.1
Percentile72th
0.1 above cohort
Similar Type
Cohort avg3.2
Your score3.1
Percentile70th
0.1 below cohort
National deep dives
Open any of the seven leading dashboards.
Legacy lens
A simpler country list.
Brazil
42 PMOsMaturity
2.8
Impact
2.3
Chile
18 PMOsMaturity
2.6
Impact
2.1
Colombia
21 PMOsMaturity
2.5
Impact
2.0
Estonia
14 PMOsMaturity
3.4
Impact
3.1
Finland
22 PMOsMaturity
3.6
Impact
3.3
Germany
38 PMOsMaturity
3.5
Impact
3.0
Indonesia
19 PMOsMaturity
2.4
Impact
2.2
Kuwait
9 PMOsMaturity
2.7
Impact
2.4
Latvia
11 PMOsMaturity
3.1
Impact
2.8
Lithuania
12 PMOsMaturity
3.0
Impact
2.7
Pakistan
17 PMOsMaturity
2.3
Impact
1.9
Peru
13 PMOsMaturity
2.5
Impact
2.1
Poland
27 PMOsMaturity
3.2
Impact
2.9
Saudi Arabia
24 PMOsMaturity
3.0
Impact
2.8
South Africa
16 PMOsMaturity
2.8
Impact
2.5
UAE
28 PMOsMaturity
3.3
Impact
3.1
Why benchmark?
Eight reasons. One model.
Benchmarking is how you turn a maturity score into a strategic conversation.
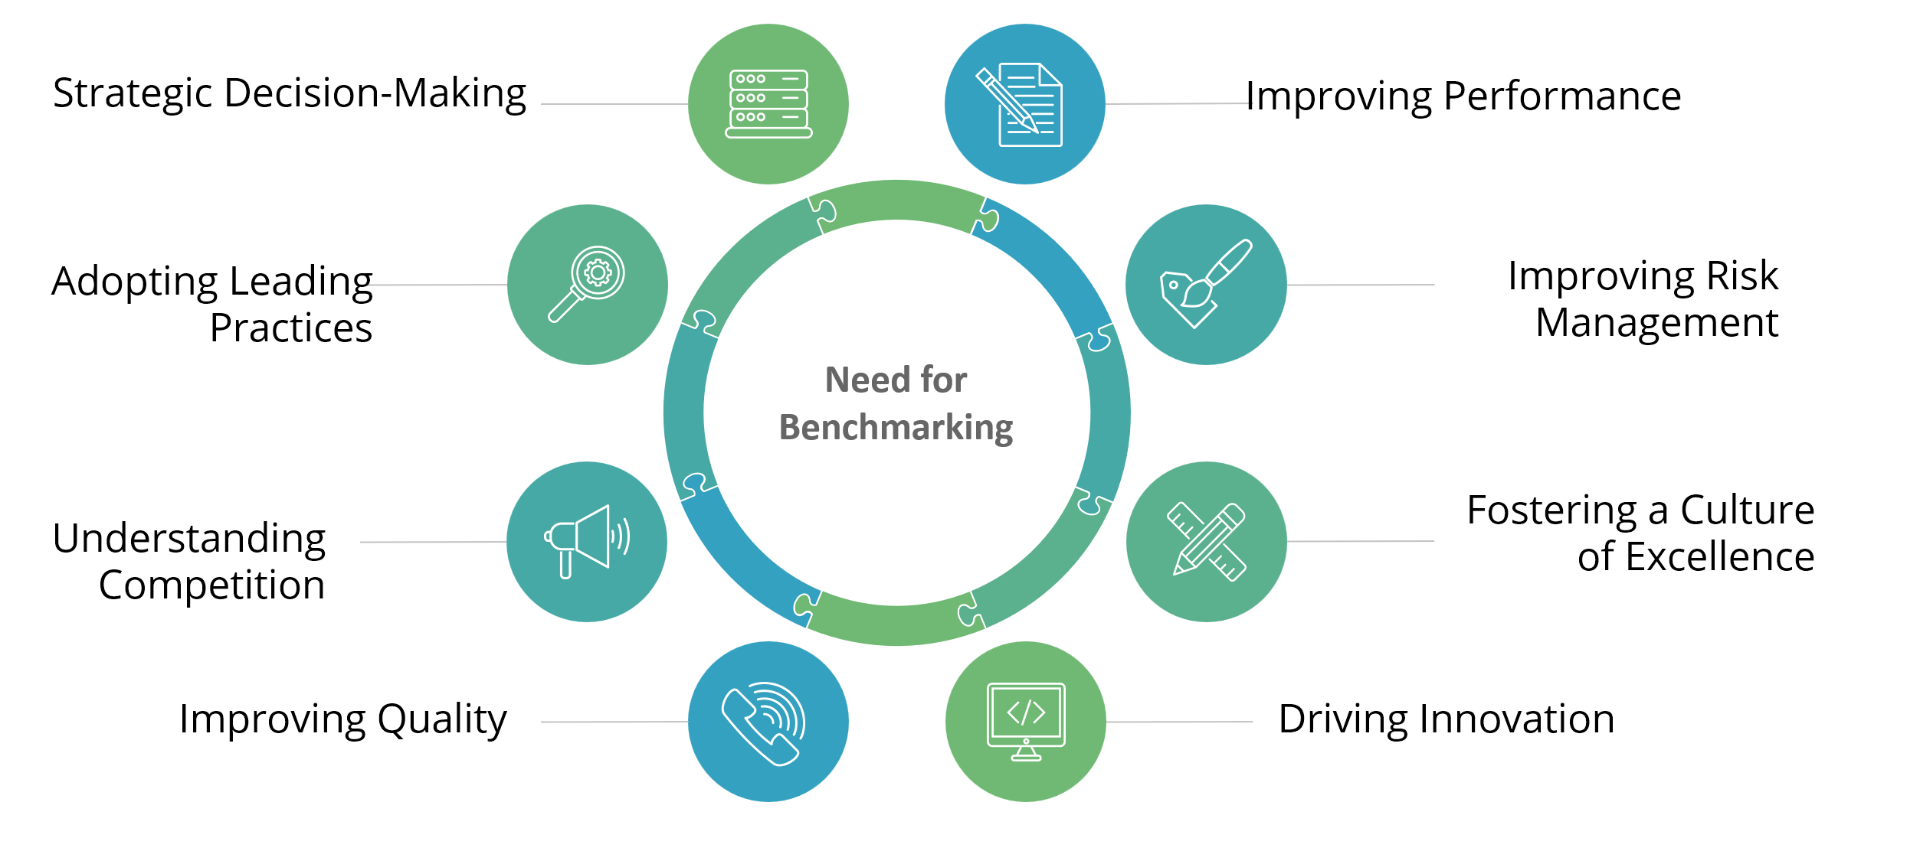
- 1Strategic Decision-Making
- 2Improving Performance
- 3Adopting Leading Practices
- 4Improving Risk Management
- 5Understanding Competition
- 6Fostering a Culture of Excellence
- 7Improving Quality
- 8Driving Innovation